Features
Learn From the Best. Fix What Matters.
Upload your group's flights and see exactly where the difference is made — thermal by thermal, glide by glide, decision by decision.
Pilot Benchmark
Learn from any pilot in the world. Upload IGC files alongside your own and compare thermal selection, glide efficiency, and climb rates side-by-side. Benchmark against your group flight, regional champions, or world record holders — the gap analysis shows you exactly where the best pilots make the difference.
Thermal Analysis
Understand how well you centered thermals and how strong they were. Compare centering quality, climb rates, and time-in-core across every thermal in your flight.
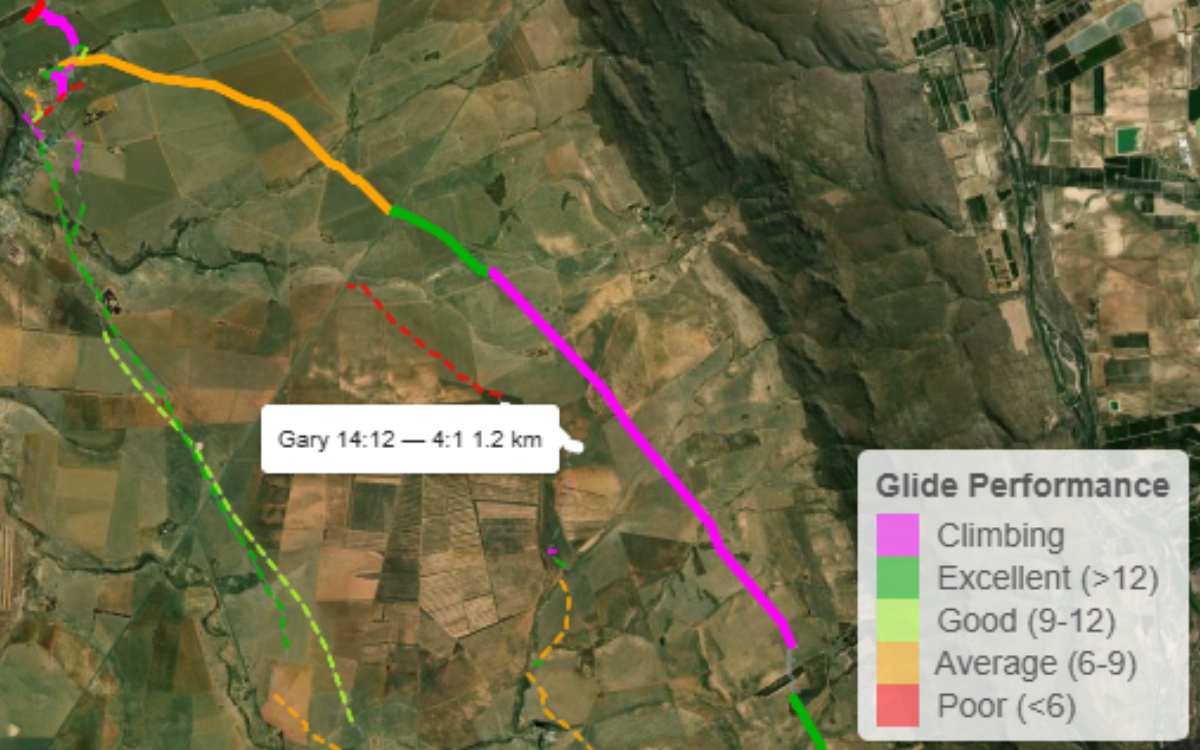
Glide Efficiency
Analyze glide ratios and speed decisions between thermals. See where you lost height unnecessarily and how adjusting your speed could improve performance.
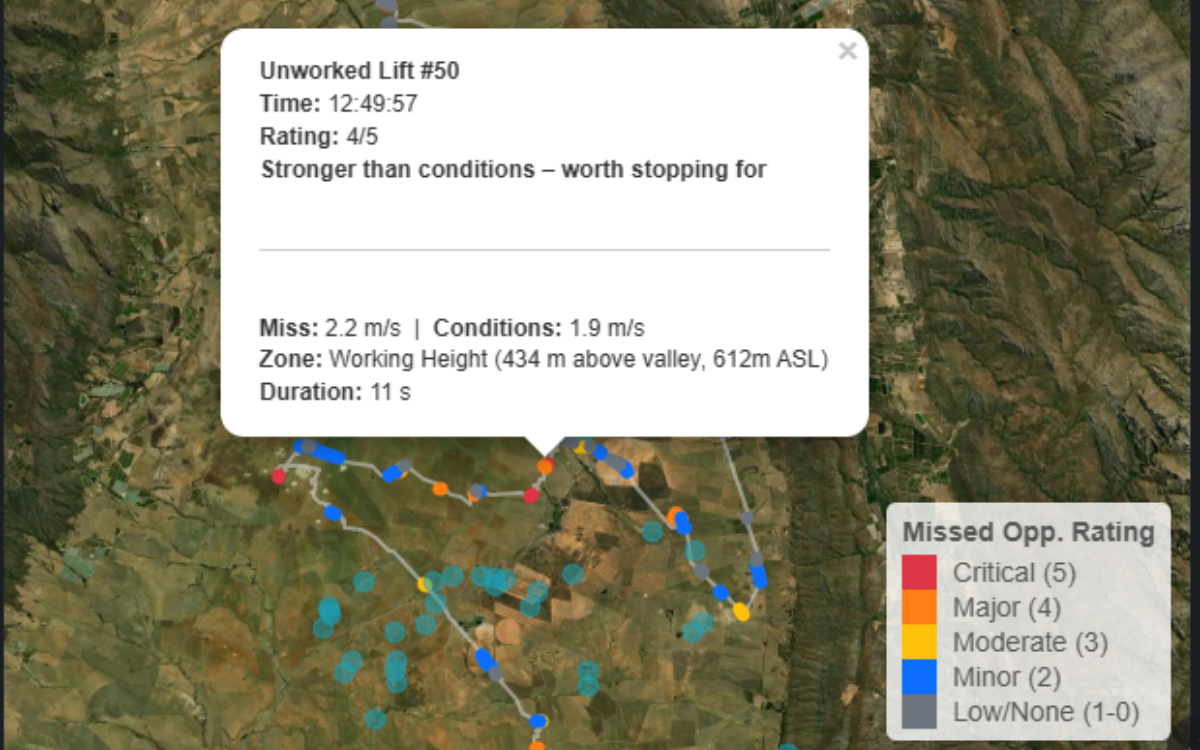
Missed Thermals
Detect lift you flew past. Parametrics identifies potential thermals along your track that you didn't use, so you can train yourself to recognize them earlier.
Risk Metrics
Identify dangerous low saves and risky decisions in your flight. Understand when you were flying close to limits and what patterns to watch out for.
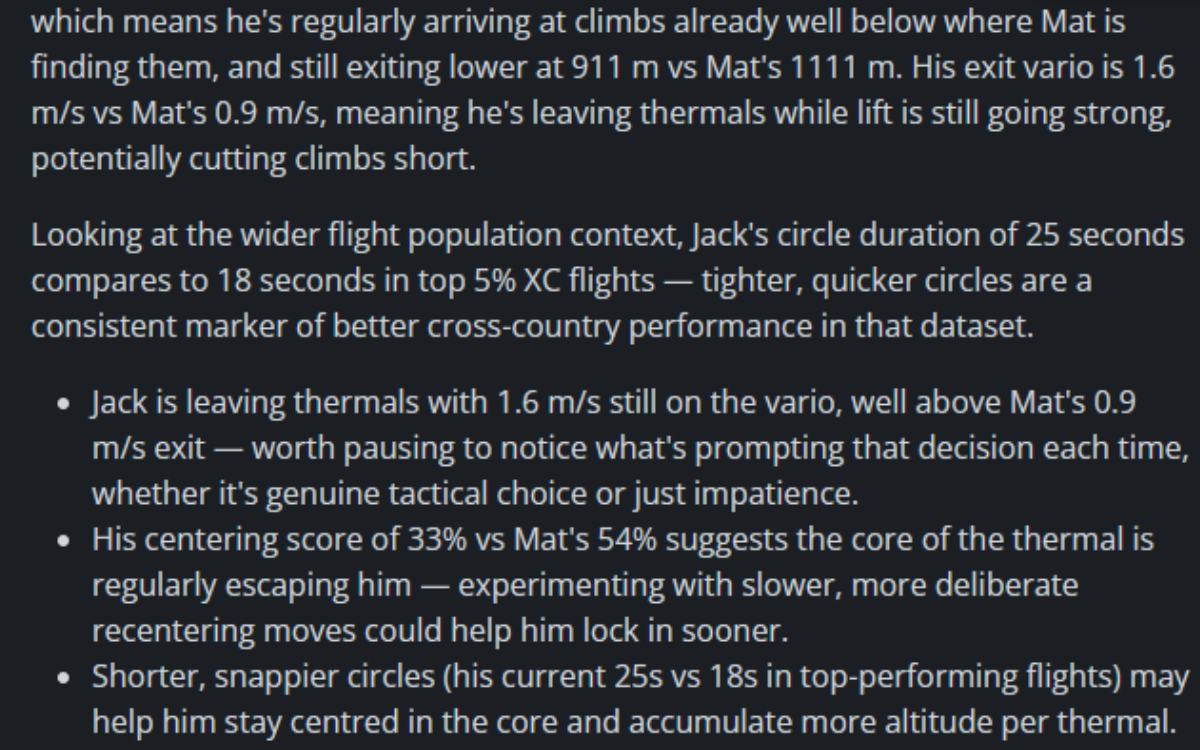
Performance Analyst
A data interpretation for every analysis page — thermal efficiency, glide, safety, landing, and task. Each summary is grounded in your actual flight metrics, cited against the reference pilot or group.
How It Works
Three Steps to Flying Like the Best
Upload Your Group's Flights
Add your IGC file alongside any pilots you want to compare — your club mates who flew the same day, a regional champion, or a world record holder. Any IGC file works.
Side-by-Side Comparison
Parametrics overlays every flight — thermals used, glide lines taken, altitudes at each decision point. You see exactly where your paths diverged and who made the better call.
Close the Gap
Get a Performance Analyst summary that names the exact moments where the benchmark pilot gained altitude on you — cited from the specific metrics in that session. No guesswork, just data.
Inside the App
Data That Actually Explains Your Flying
From your first thermal to your final glide — every decision, quantified and explained.
Stories
Case Studies & Insights
Barberton Open 2026 – Learning Through Data
Five taskable days, 86 pilots, and a second place finish in EN D. How a year of analysing flight data translated into better performance at the biggest Barberton competition I've flown.
Read →Why I Built Parametrics
The story behind Parametrics — how accident investigation, instructing, and trying to improve my own flying led to a platform built on real data.
Read →How It Works
How Parametrics processes your IGC file — from signal cleaning to AI interpretation — and what each stage of analysis actually measures.
Read →Pricing
Try Pro Free for 60 Days
Full Pro access from day one. No credit card required.
Monthly
60-day free trial, then R60/month
- Upload and process IGC flight files
- Full flight summary (duration, altitude, thermals, wind, landing finals)
- Altitude timeline and flight phase breakdown
- Interactive flight map
- Thermal performance overview (avg climb rate, centering score, commit delay)
- Safety overview (time below 100m AGL, low save count)
- Landing analysis (8 metrics, final turn altitude, Safe/Tight/Risky verdict)
- Landing approach map (2D satellite view)
- Glide performance overview (avg ratio, avg speed)
- Performance Analyst on every analysis page (Safety, Glide, Landing, Overview, Comparison)
- Missed thermal opportunities — map showing exact locations, strength, and altitude
- 3D landing approach visualization (interactive, rotatable)
- Glide performance map
- Multi-pilot comparison (up to 10 pilots per report)
- In-Depth and Full Analytics modes
- Benchmark pilot comparison (compare against any named pilot)
- Wind analysis map
- 20 reports per month
- Permanent report archive — access any past report, forever
No credit card required
Annual
60-day free trial, then R600/year
- Upload and process IGC flight files
- Full flight summary (duration, altitude, thermals, wind, landing finals)
- Altitude timeline and flight phase breakdown
- Interactive flight map
- Thermal performance overview (avg climb rate, centering score, commit delay)
- Safety overview (time below 100m AGL, low save count)
- Landing analysis (8 metrics, final turn altitude, Safe/Tight/Risky verdict)
- Landing approach map (2D satellite view)
- Glide performance overview (avg ratio, avg speed)
- Performance Analyst on every analysis page (Safety, Glide, Landing, Overview, Comparison)
- Missed thermal opportunities — map showing exact locations, strength, and altitude
- 3D landing approach visualization (interactive, rotatable)
- Glide performance map
- Multi-pilot comparison (up to 10 pilots per report)
- In-Depth and Full Analytics modes
- Benchmark pilot comparison (compare against any named pilot)
- Wind analysis map
- 20 reports per month
- Permanent report archive — access any past report, forever
No credit card required
Cancel anytime · No long-term contracts · Charged in ZAR